
An audiogram is a graph or chart that displays the results of your hearing test. Initially, it might look like a bunch of indecipherable lines and symbols. But once you learn how to read and interpret your audiogram, you will better understand your hearing loss. Even more important, your hearing care professional will use the results to help determine the best type of hearing aid for you.
An audiogram measures hearing ability
The goal of audiometric testing is to measure your hearing ability across a range of frequencies in each ear independently. This testing produces a chart called an audiogram.
Hearing threshhold
The audiogram plots your hearing thresholds across various frequencies, or pitches, in a quiet listening environment. A hearing threshold is defined as the softest sound you are able to detect about 50 percent of the time. So don’t be surprised if you feel like you “missed” some of the beeps.
An important thing to remember is that the audiogram is quantitative, not qualitative. It uses a specific numerical system to measure residual hearing ability in quiet rooms; it doesn’t subjectively describe the quality of your hearing ability. It also can’t detect if you have hidden hearing loss.
How to read an audiogram
Looking at the audiogram graph, you will see two axes:
The horizontal axis (x-axis) represents frequency (pitch) from lowest to highest. The lowest frequency tested is usually 250 Hertz (Hz), and the highest is usually 8000 Hz. You can think of the frequency axis like the keys on a piano where the sounds become higher pitched as you progress from left to right. Most speech falls into the 250 to 6000 Hz range, with the vowel sounds among the lowest frequencies and the consonants such as S, F, SH, CH, H, TH, T and K sounds among the highest frequencies.
The vertical axis (y-axis) of the audiogram represents the intensity (loudness) of sound in decibels (dB), with the lowest levels at the top of the graph. Although the top left of the chart is labeled -10 dB or 0 dB, that does not mean the absence of sound. Zero decibels actually represents the softest level of sound that the average person with normal hearing will hear, for any given frequency. (It’s actually a normative curve that has been straightened out!)
What do the symbols on an audiogram mean?
There are several different symbols used to indicate thresholds on an audiogram, depending on the specific testing conditions. Testing with headphones is called air conduction testing because the sound must travel through the air of the ear canal to reach the inner ear. The air conduction results for the right ear are marked with a red “O,” and the results for the left ear are marked with a blue “X.” Bone conduction testing, in which a device is placed behind the ear in order to transmit sound through the vibration of the mastoid bone, is marked with a “[“ or a “<” symbol.
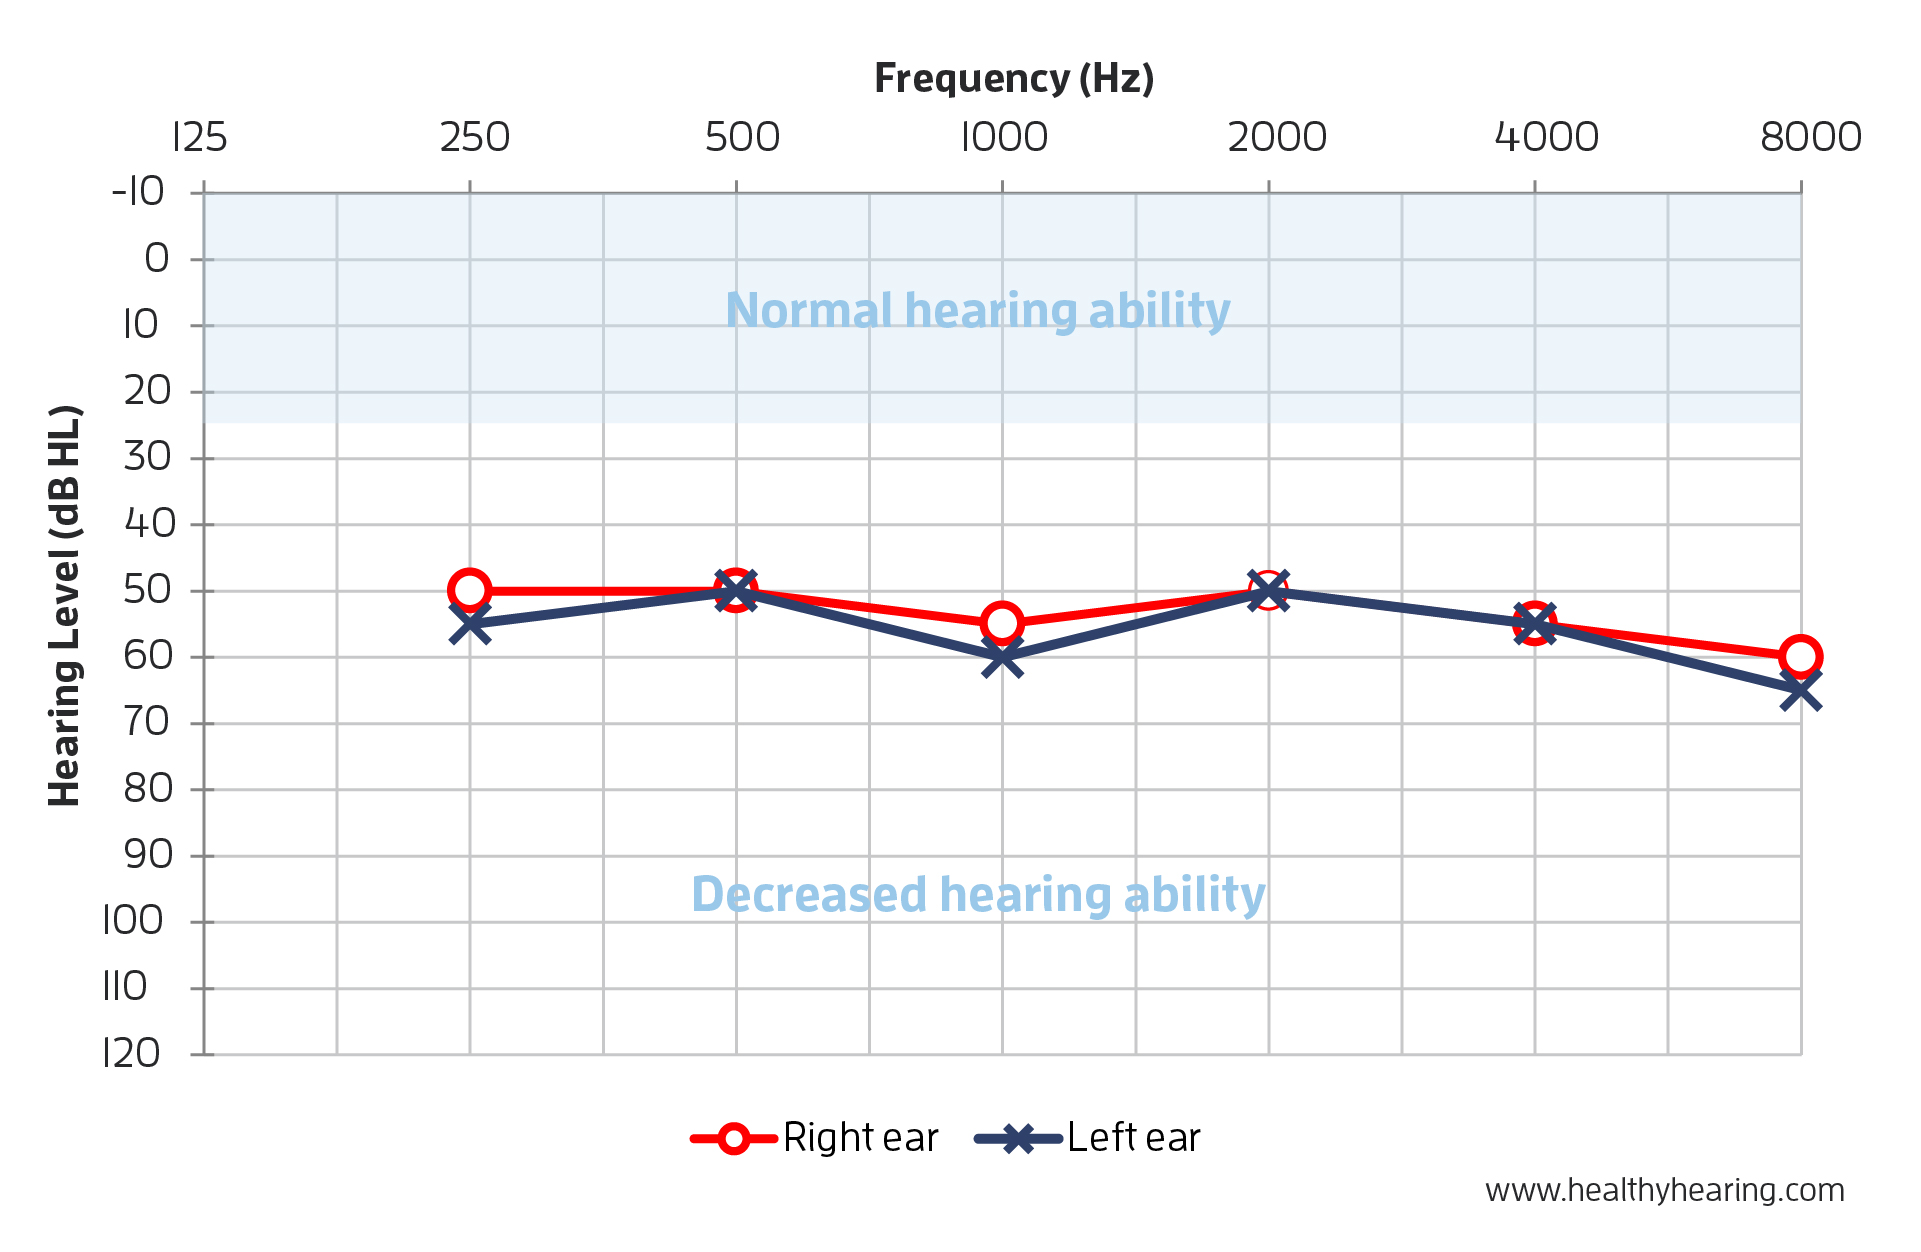
The important thing to understand is that the responses from the left ear are represented in blue, and those from the right ear are represented in red. Each symbol on the chart represents your threshold for a given frequency. In the example above, the individual’s threshold for 2000 Hz was 50 dB in each ear. Once all of the thresholds are measured and plotted on the graph, they are connected to form easy-to-read lines for the left and right ears.
If the two lines are essentially overlapping, your hearing loss is considered symmetrical, or the same in both ears. If the lines are not overlapping your hearing loss is considered asymmetrical, meaning your ears have differing degrees of hearing loss.
What is normal hearing on an audiogram?
Looking at the above audiogram, normal hearing ability is represented in the blue shaded area above the 25-dB line that crosses the graph from left to right. If your threshold symbols fall in the blue-shaded area, your hearing ability is considered within normal limits. Any symbols below that shaded area, however, indicate hearing loss at those frequencies.
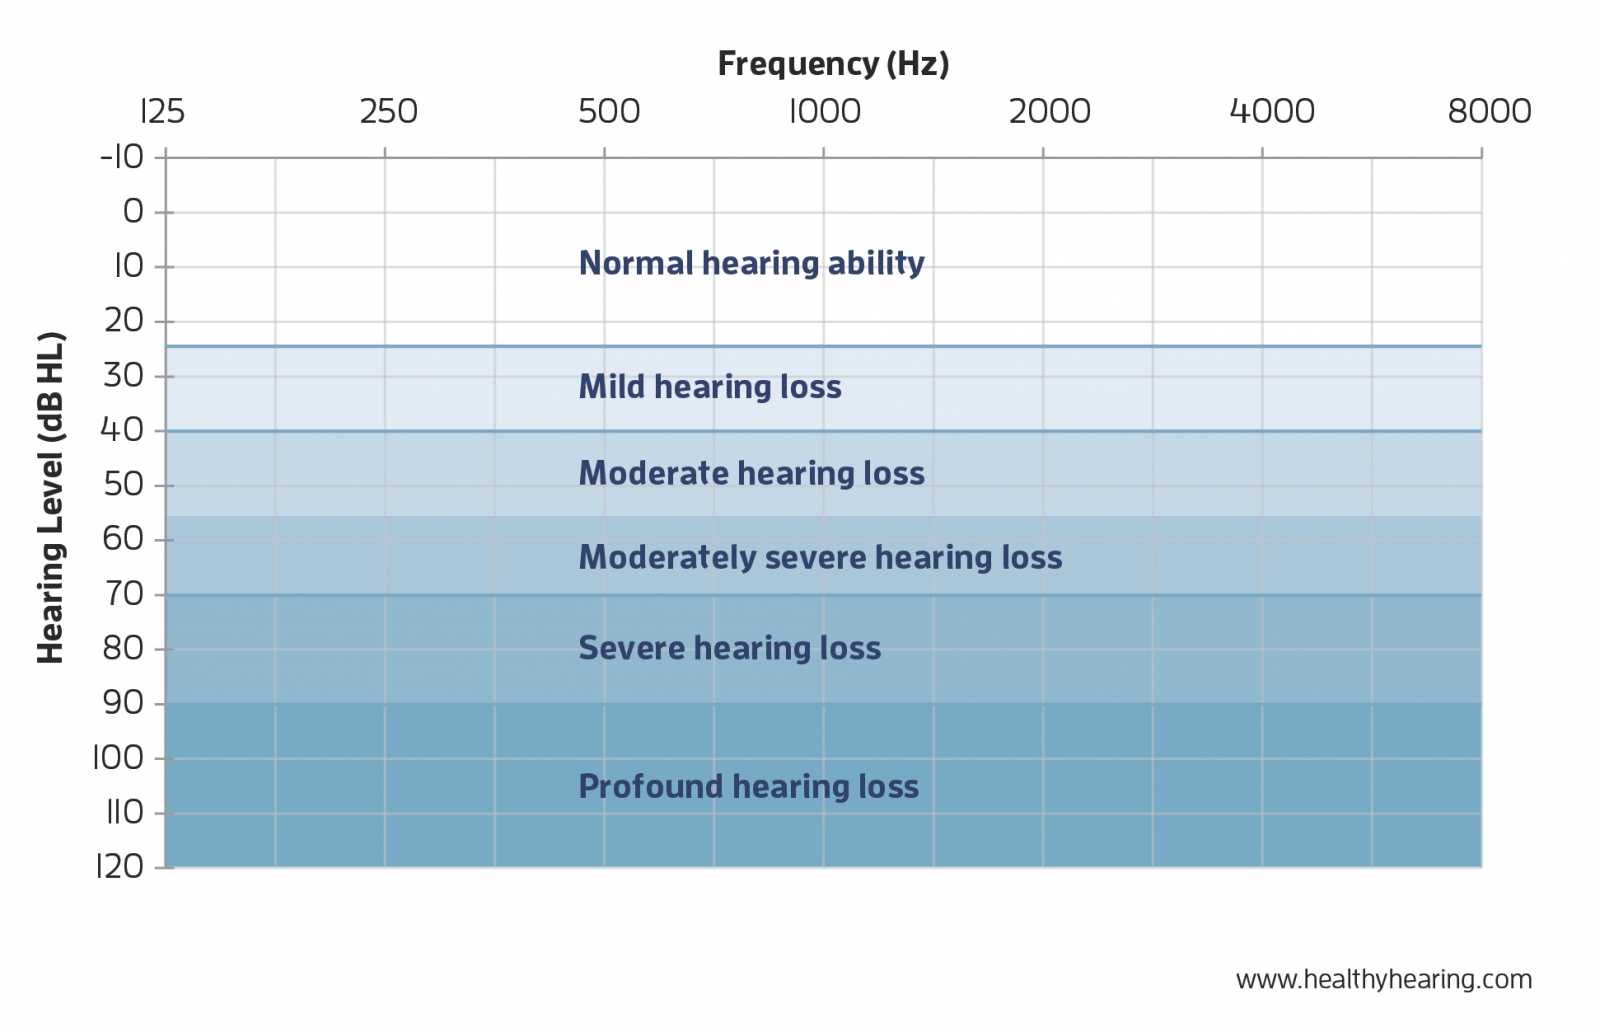
Your hearing care professional will classify the severity of your hearing loss, or degree of hearing loss, by where the symbols fall on the graph. Hearing loss is often classified as slight, mild, moderate, moderate-to-severe, severe or profound. They will also describe the pattern of your loss, generally as flat, sloping or rising.
The space between the normal hearing area and your threshold symbols represents all of the sounds you’re missing because of your hearing loss. The bigger the space, the more sounds you’re not hearing. For most people with hearing loss, hearing aids can be a solution to bridge that gap and give you back the sounds you’re missing.
What’s a normal hearing level on an audiogram?
An adult is classified as having normal hearing ability if their responses indicate they heard noises between 0 and 25 dB across the frequency range. A child is considered to have hearing ability within normal limits if their responses are between 0 to 15 dB across the frequency range.
Keep a copy of your audiogram and other test results
After your visit to the hearing center, they should provide you with a report of your visit. If not included with the report, request a copy of your audiometric test results. Not only will these results serve as a prescription for you, but it will serve as a baseline for you and your hearing care professional to monitor any changes in your hearing down the road.
If you have been struggling to hear or have noticed a ringing in your ears, use our directory to find a hearing center near you. Then take it a step further and learn how to read your audiogram. This will enable you to be an active participant in your hearing health care and to make informed decisions about your treatment options.